
The software and programs that data analysts use to acquire, store, convert, and analyze data are known as data analytics tools. Businesses no longer require skilled data analysts to execute or understand data analytics, thanks to introducing low-code solutions on the market.
Any expert in any sort of organization may utilize simple data analytics tools to convert data automatically. Data analysts and data scientists cannot do their jobs well without data analytics tools. Even Big Data analytics service providers might use data analytics tools. Data scientists may use data analytics technologies in conjunction with the proper infrastructure and expertise to uncover significant trends and patterns in data, which can aid in the development of data-driven initiatives.
Understanding your company objectives and goals is the first step in selecting the proper data analytics platform. It might be tough to pick the finest tool when there are so many on the market.
ServiceNow Power BI integration helps track personalized metrics, KPI, overall team performance in real-time by scheduling refreshes, and also visualize team contribution to the overall result.
But keep in mind that the best one is determined by the demands of data analysts, the goals of companies, and a variety of other variables. We have compiled a list of the best data analytics tools and software for this year to aid in data-driven decision-making.
1. Datapine
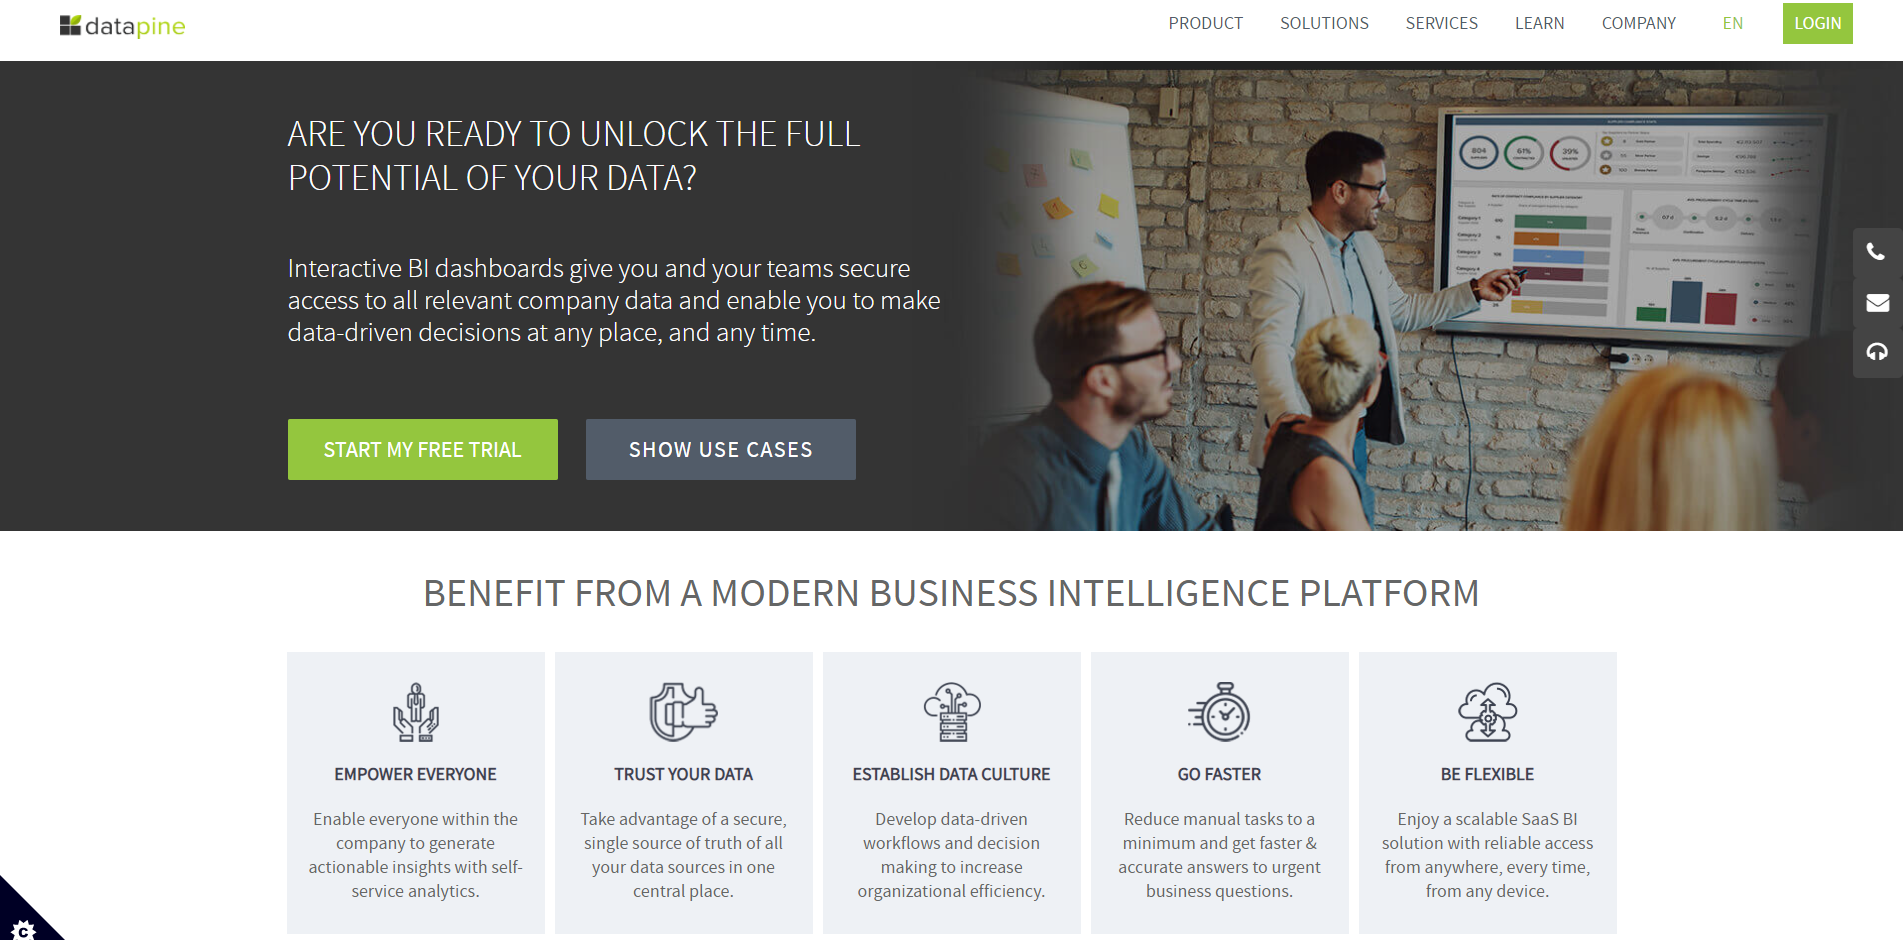
Datapine is a famous business intelligence program that offers basic yet strong analysis capabilities to beginners and expert users who want a quick and dependable online data analysis solution. You can easily drag and drop your chosen numbers into Datapine’s Analyzer and build various charts and graphs with an attractive user interface.
If you are a seasoned analyst, you might want to explore using the SQL mode, which allows you to create your own queries while still allowing you to quickly go back to the visual mode. The predictive analytics forecast engine is another important aspect. While many prediction tools are available, Datapine’s offers the best in terms of simplicity and speed.
2. Python

Python is a high-level, interpreted programming language that may be used for anything. Python’s design philosophy prioritizes code readability, as seen by its extensive use of whitespace. Its language features and object-oriented approach are designed to help programmers produce clear, logical code for both small and large-scale projects.
Python is a popular tool among users looking for an open-source solution and straightforward coding procedures, thanks to its simple syntax. Python-based software analyses can do a variety of analyses on their own, as well as interact with third-party machine learning and data visualization programs. Additionally, exploring python etl tools can help enhance data extraction, transformation, and loading processes, making Python an even more powerful tool for managing complex data workflows.
3. SAS
The potential of SAS to automate forecasting for big businesses or goods is well-known. Event modeling, what-if analysis, scenario planning, and hierarchical reconciliation are all capabilities of the system. Its simple graphical user interface (GUI) allows users to easily automate their operations.
SAS delivers a fully developed application that fulfills the demanding inquiries of data scientists while still being accessible to less-trained personnel. SAS has been in the software industry for decades. SAS has improved its augmented analytics solutions in line with current trends, as the usage of machine learning, artificial intelligence, and automation is now a top demand among analytics customers.
Furthermore, this data package enables customers to create a huge number of predictions and automate their operations by combining the SAS Forecast Server and Visual Forecasting solutions. Since the firm has been around for decades, they have established themselves as a predictive analytics authority figure; thus, it makes sense to give them a shot.
4. Tableau

Tableau is a business intelligence tool that allows data analysts to display, analyze, and experience their data in a variety of ways. Tableau delivers fast analytics and will examine a wide range of data sources, including spreadsheets, databases, Hadoop data, and cloud services. Because it has a strong user interface, it is straightforward to use.
It will make it easier to create powerful interactive dashboards. Tableau is an industry leader that allows you to deal with real-time data rather than wasting time on data manipulation.
Tableau Desktop, Tableau Server, Tableau on-line, Tableau Reader, and Tableau Public are the products that are contained with Tableau. Another benefit of using Tableau is that it is completely free.
5. Qlick

Qlik is a great option if your company wants to utilize machine learning and artificial intelligence to improve data mining quality. Qlik’s mix of capabilities delivers a compelling vision in the data analytics field, with two decades of experience. The company’s Qlik Sense platform, for example, includes sophisticated forms of artificial intelligence and machine learning.
It also does it without having sophisticated data science expertise, allowing sales reps and mid-level employees to use AI for data mining.
Because Qlik Sense is cloud-agnostic, businesses may use it with any cloud in their multi-cloud infrastructure. For a hybrid data analytics strategy, they can implement on-premises and then connect the application to the cloud.
6. Apache Spark

One of the most powerful open-source big data analytics tools is Apache Spark. It comes with over 80 high-level administrators that make putting together parallel applications a breeze. It is an open-source data analytics tool that is used by a variety of businesses to manage large datasets. It is one of the open-source big data analytics solutions with Java, Scala, or Python APIs built-in.
7. Looker
Looker provides a data analytics and business intelligence platform based on LookML, the company’s proprietary modeling language. The online analytics component of the tool emphasizes filtering and penetrating capabilities, allowing users to deliberately dive into row-level information.
Embedded analytics is a type of analytics that is integrated into a system. Powered by Looker takes advantage of current data sets as well as an agile modeling layer that allows users to classify data and manage access. Companies can send reports by email or webhook using Looker’s complete RESTful API or the schedule element.
Final Thoughts
Working in any firm entails gathering data with the goal of gaining important insights. Your company may profit from any of the aforementioned data analytics solutions by being able to obtain optimal outcomes while lowering expenses. Using past data, data analytics helps you to anticipate the future.
We have described what data analysts use and given a brief overview of each to provide you the information you need to pick the one (or multiple) that best fits your analytical procedures. We encourage you to check them all out, and for sure, you will find something that fits just for you.
Comments are closed.