
A forex chart pattern is a graphical representation of currency price movements. Some traders use a methodology called technical analysis, using these patterns to predict future price action and trade accordingly.
Chart patterns are popular among technical traders because they can provide hints to future market direction. Common forex chart patterns include the head and shoulders, double top/bottom, and triangle.
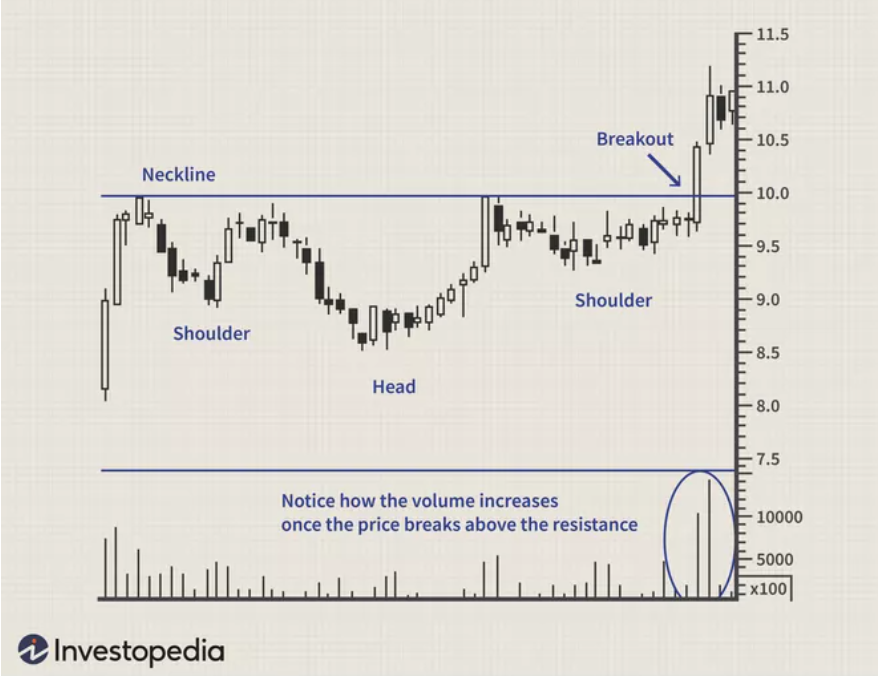
Head and Shoulders
:max_bytes(150000):strip_icc():format(webp)/dotdash_Final_Head_And_Shoulders_Pattern_Sep_2020-01-4c225a762427464699e42461088c1e86.jpg)
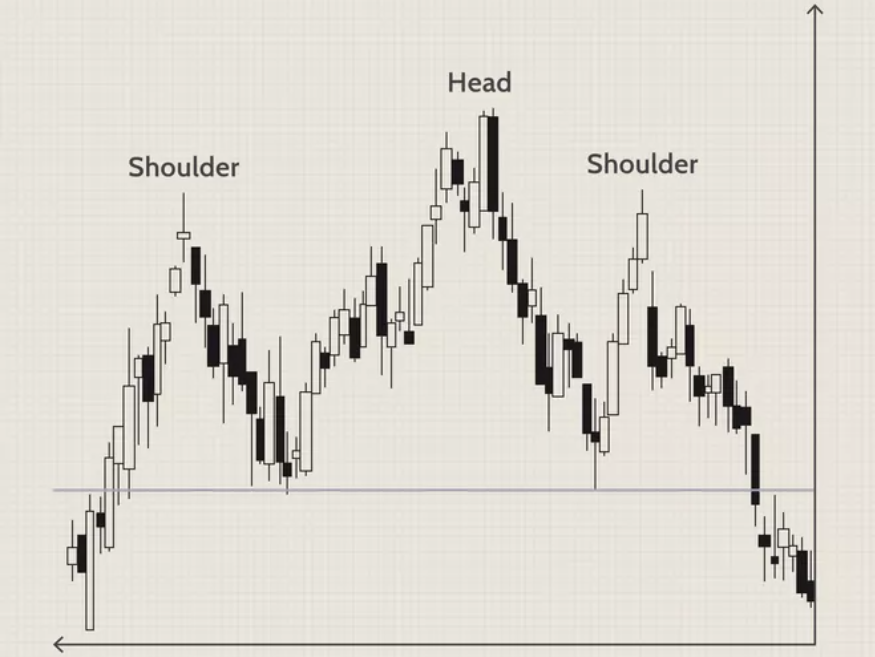
The head and shoulders pattern is a reversal pattern in forex trading. It is characterized by a left shoulder, a head, and a right shoulder, with the head being the highest point and the shoulders being of equal height. The pattern is complete when the price breaks below the neckline. It is formed by connecting the lows of the left shoulder and the head.
The head and shoulders pattern is a bearish pattern, which signals a potential reversal from an uptrend to a downtrend. Therefore, you would want to sell when the price breaks below the neckline.
Double Top/Bottom
:max_bytes(150000):strip_icc():format(webp)/dotdash_Final_Double_Top_and_Bottom_Feb_2020-01-568b13a6e22548a48c0f5251e2069db5.jpg)
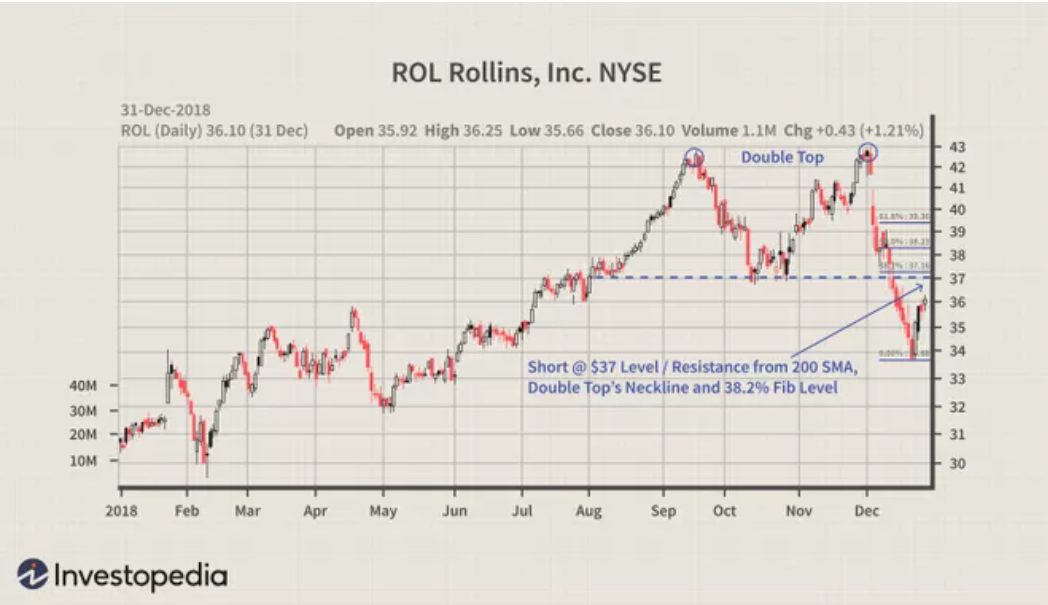
The double top/bottom pattern is another reliable reversal pattern that you can find in forex charts. It is characterized by two highs or lows that are approximately equal in height. The double top is bearish and signals a potential reversal from an uptrend to a downtrend. The double bottom is a bullish pattern that signals a potential reversal from a downtrend to an uptrend.
A trader can identify a complete double top/bottom pattern when the price breaks below the support level for a double top or above the resistance level for a double bottom. Once the pattern is completed, you can enter a trade in the breakout direction.
Triangle
:max_bytes(150000):strip_icc():format(webp)/dotdash_Final_Descending_Triangle_Definition_Nov_2020-01-6947940abf92483ba58b086049e5addd.jpg)
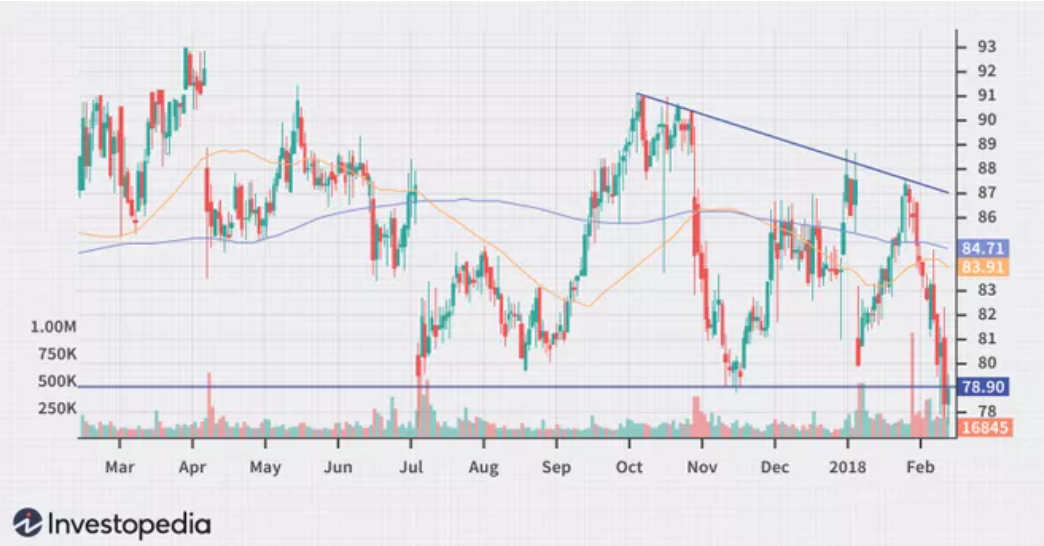
The triangle pattern is a continuation pattern that you can find in both uptrends and downtrends. It is characterized by converging trendlines, with the lower trendline being support and the upper trendline being resistance. The triangle pattern is completed when the price breaks out of either trendline.
If the price breaks out of the upper trendline, it signals a continuation of the uptrend. If the price breaks out of the lower trendline, it signals a continuation of the downtrend. Therefore, you would want to enter a trade in the breakout direction.
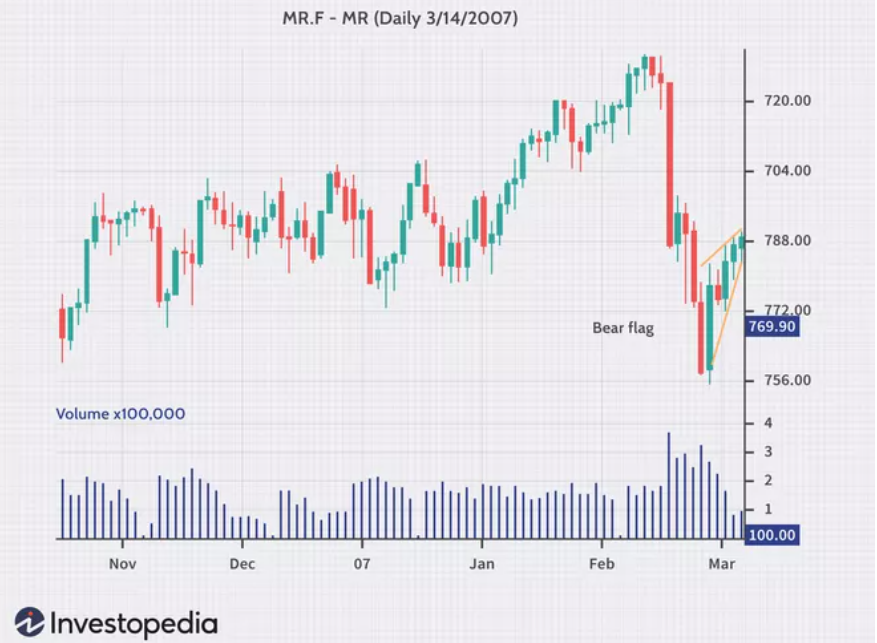
Flag and Pennant
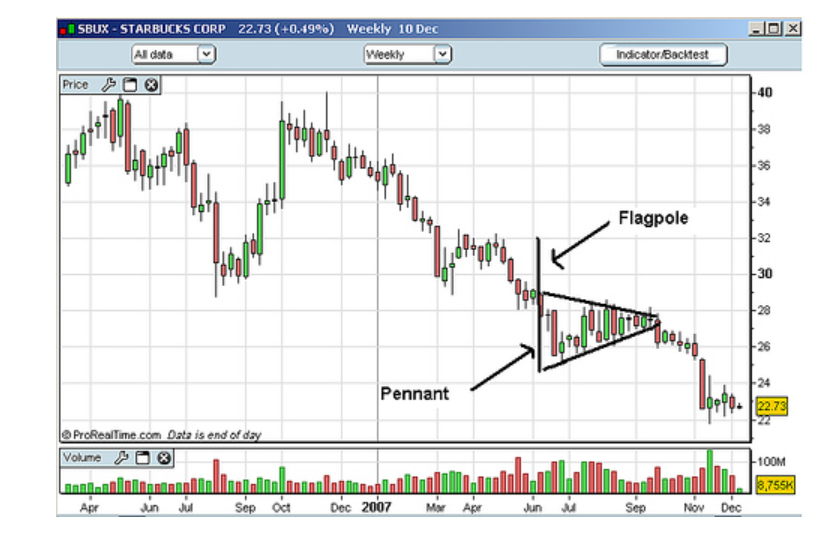
The flag and pennant pattern is a continuation pattern that you can find in both uptrends and downtrends. It is characterized by a short consolidation period after a sharp price move. The flag is completed when the price breaks out of the consolidation period in the same direction as the initial price move.
The flag and pennant pattern is a bullish continuation pattern when it forms in an uptrend, and it is a bearish continuation pattern when it forms in a downtrend. Therefore, you would want to enter a trade in the direction of the initial price move when the consolidation period is completed.
Wedge
:max_bytes(150000):strip_icc():format(webp)/dotdash_Final_Tales_From_the_Trenches_The_Rising_Wedge_Breakdown_Dec_2020-02-6aabced0283542299f9f1a34d66c9356.jpg)
The wedge pattern is a continuation or reversal pattern that you can find in both uptrends and downtrends. It is characterized by converging trendlines that are getting closer and closer together. The wedge pattern is completed when the price breaks out of either trendline.
If the price breaks out of the upper trendline, it signals a continuation of the uptrend. If the price breaks out of the lower trendline, it signals a continuation of the downtrend. However, if the price breaks out of the wedge in the opposite direction, it signals a potential reversal. Therefore, you would want to enter a trade in the breakout direction once the pattern is completed.
Head and Shoulders Top/Bottom
The head and shoulders top/bottom pattern is a reversal pattern that you can find in both uptrends and downtrends. It is characterized by a left shoulder, a head, and a right shoulder, with the head being the highest point or the lowest point.
The pattern is concluded when the price breaks below the neckline for a head and shoulders top or above the neckline for a head and shoulders bottom. The head and shoulders top/bottom pattern is a bearish reversal pattern when it forms in an uptrend, and it is a bullish reversal pattern when it forms in a downtrend.
Therefore, you would want to enter a trade in the breakout direction once the pattern is completed.
Comments are closed.